Overview
Enable UI Debug
UI Wrapping and UI Debugging
Inspector Windows
Log Messages
Test Script
SoftwareShield provides javascript API for the HTML-based UI pages by the following files:
Javascript Files
- UI_HTML\js\gs5.js
The core SDK file provides the following APIs:
- License status accessing;
- Offline Activation: License request code generation and activation code apply;
- Online Activation: Serial number apply and revoke;
- Native OS support (file system, clipboard, environment variables, command lines, locale);
- Media support (Video, audio, Email);
- Application control (Restart, Terminate);
- UI control (show, hide, goto, etc.);
The latest gs5.js and its minified version can be downloaded from the following URLs:
- https://shield.yummy.net/CheckPoint2/js/gs5.js
- https://secure.yummy.net/CheckPoint2/js/gs5.js
- https://shield.yummy.net/CheckPoint2/js/gs5.min.js
- https://secure.yummy.net/CheckPoint2/js/gs5.min.js
-
UI_HTML\js\ GS_Mapping.js
The IDE auto-generated file contains definations of:
- Global variables and functions;
- CheckPoint servers;
-
UI_HTML\js\shield.js
It is based on gs5.js and provides the following APIs:
- CheckPoint server communication;
- Activation;
- License Parameter Parser;
The latest shield.js and its minified version can be downloaded from the following URLs:
- https://shield.yummy.net/CheckPoint2/js/shield.js
- https://secure.yummy.net/CheckPoint2/js/shield.js
- https://shield.yummy.net/CheckPoint2/js/shield.min.js
- https://secure.yummy.net/CheckPoint2/js/shield.min.js
To use the SDK api in a HTML page, please add the following lines to your HTML source:
<script type="text/javascript" language="javascript" src="js/gs5.js" />
Enable UI Debug
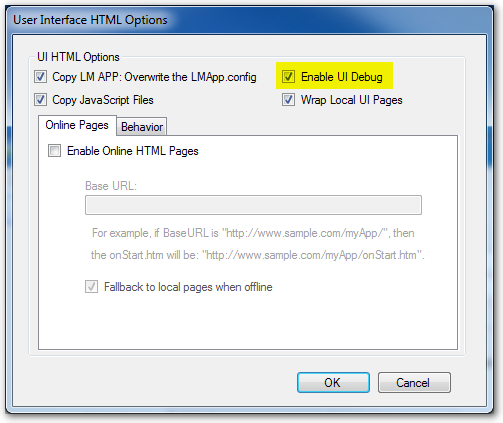
To enable UI debugging, you must explicitly turn on the feature as following:
IDE main menu => Edit => UI Options:
UI Wrapping and UI Debugging
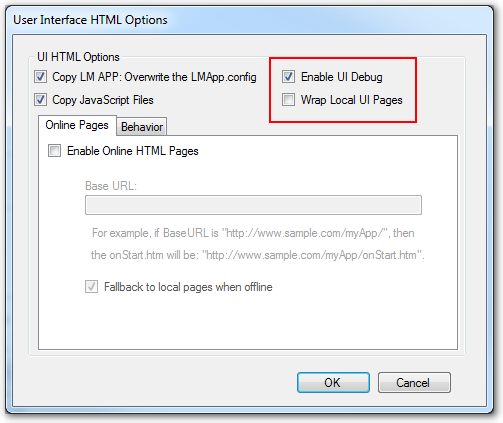
If you want to edit UI files during debugging, you must disable the "Wrap UI Pages" option; Normally if UI pages are not wrapped, for security reason the Integrity Protection is automatically turned on to make sure the UI files are not modified by users, however, if the "Enable UI Debug" option is turned on, the Integrity Protection is turned off so that you can edit these UI files in wrapped app during UI debugging.
Once the UI debugging is enabled, there are several facilities to help your debug task:
Inspector Windows
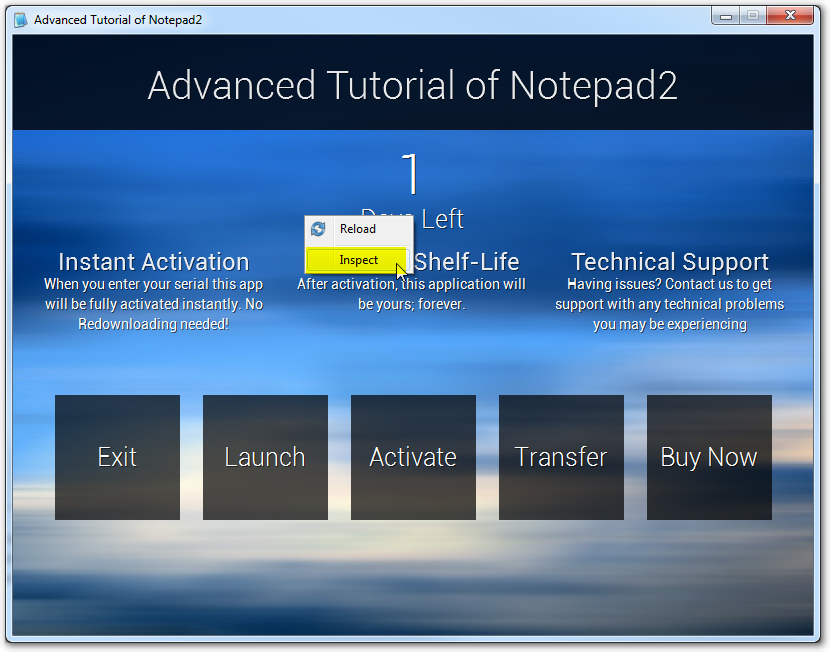
When app launching, right click mouse will pop-up a context menu with Inspector menu item:
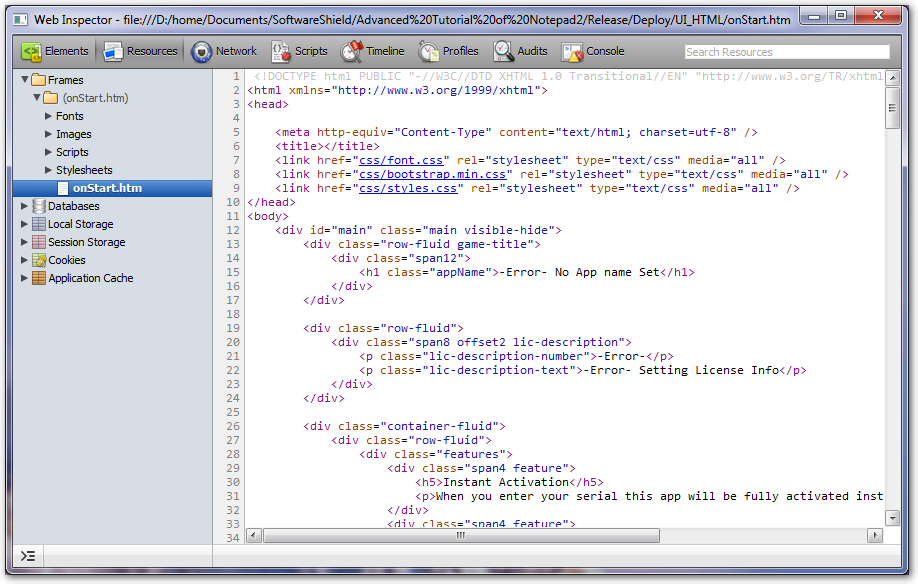
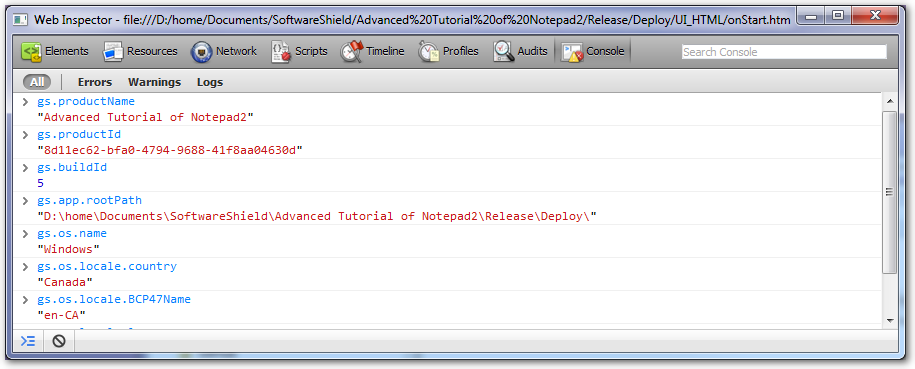
The inspector windows allow you to do most HTML / Javascript debugging:
Log Messages
Output debug message at run-time:
console.log('hello world!');
The message is displayed in the console of Inspector.
On Windows platform, you can also use the DebugView Utility:
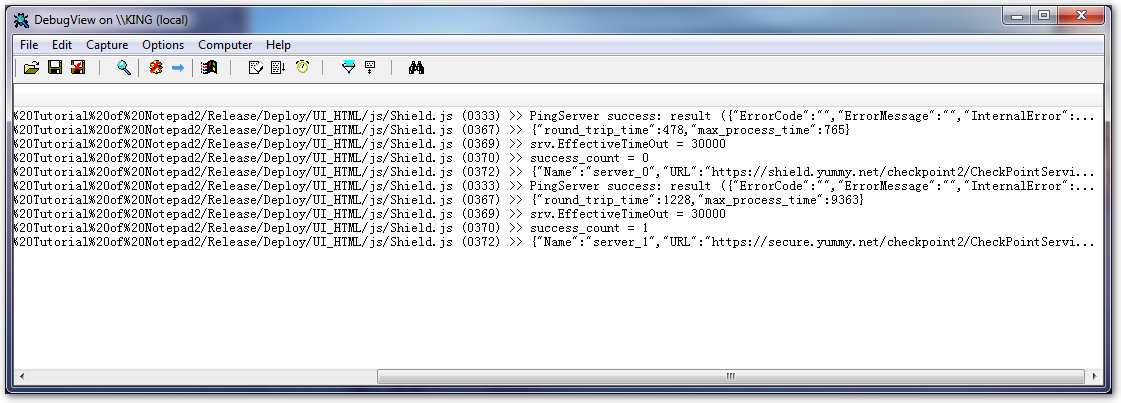
Note that the message is not dumpped to debug log file, to log debug message please refer to Output Debug Message.
Test Script
You can setup environment variable GS_UI_TESTJS to point to a javascript file, which will be loaded automatically and executed upon HTML page loading.