Debug How-to
Debug Log File name
Debug Log Folder
Desktop App
IIS/WebApp, Service
Specify Debug Log File Explicitly By Environment Variable
Debug Level
Maximum Log File Size
Log SDK API
UI debugging
Crash Dump
License Snapshot Utility
License Clean Utility
SoftwareShield provides the following ways to support app debugging:
Runtime Debug Message Log (Since v5.3.7)
When SoftwareShield protected app is running, the SDK will output text messages at runtime to help debugging, the messages are saved in a log file on the local hard disk.
Debug Log File name
- Before SDK v5.3.8:
<appName>.<sessionID>.log
- After SDK v5.3.8:
<appName>.<sessionID>.<index>.log
The <appName> is the product name specified in app's license project, <sessionID> is an unique integer for each app run.
since v5.3.8, the log file is splited into multiple files with each of them has a maximum of 10 MB size, <index> is the index for each log file, the first index starts with 1. For a long term app with lots of log messages, if the total size of messages exceeds 40 MB, only the latest 4 files are kept, the older ones are removed automatically.
To find the latest log file, you can sort the file list by date and pickup the latest one.
Debug Log Folder
Where to find the log file? it depends on the way the app is invoked.
Desktop App
For desktop app invoked interactively by end user, the debug log file will be generated in a subfolder ("\gs5") of current user's home directory
<HomeDir>\gs5\
The HomeDir is the current user's home directory which is OS-specific, the debug log folder is as follows:
| Operating System | Debug Log Directory |
|---|---|
| Microsoft Windows 2000, XP and 2003 | c:\Documents and Settings\<username>\gs5\ |
| Microsoft Windows Vista, 7, 8 and 10 | c:\Users\<username>\gs5\ |
| MacOS | /Users/<username>/gs5/ |
IIS/WebApp, Service
If your software is not a normal desktop app, for example, your app is deployed as an IIS plugin or a web app, or running as a background service that is not invoked interactively by a user, the log file directory will be:
| Operating System | Debug Log Directory |
|---|---|
| Microsoft Windows 2000, XP and 2003 | c:\Documents and Settings\\All Users\gs5\ |
| Microsoft Windows Vista, 7, 8 and 10 | c:\ProgramData\gs5\ |
Specify Debug Log File Explicitly By Environment Variable
You can specify where to store the debug log file by setting an environment variable IW_DEBUG_DIR:
On Windows:
REM Save log file to my temp folder
set IW_DEBUG_DIR=d:\tmp
On MacOS:
# Save log file to my temp folder
export IW_DEBUG_DIR=/tmp
Debug Level
To control how many details should be logged in the log file, you can set an environment variable gs_debug_level to one of the following debug levels:
| Debug Level | Meaning |
|---|---|
| info | detailed information |
| warn | something unexpected occurs, does not affect app running |
| error | (Default) something is wrong, however most likely app can still run |
| fatal | critical error is detected, app should not run |
For example:
REM On Windows, set debug level to "warn" to dump warn, error and fatal messages
set gs_debug_level=warn
If not specified, the default debug log level is "error".
The level order is:
info > warn > error > fatal
For example, if you set the debug level to be warn, the logged messages will include all warnnings, non-fatal errors and fatal errors.
Maximum Log File Size
-
Before SDK v5.3.8: The maximum debug log file size is 10MB, the file will be truncated from start after the limit is reached.
-
After SDK v5.3.8: The maximum debug log file size is 10MB, only the latest 4 log files kept for each app run, earlier files are deleted
Log SDK API
The SoftwareShield SDK has log api that can be used to output your own app messages.
- C
  #include <gs5_intf.h>

  gsTrace("Hello World!");
- C++
  #include <gs5.h>

  TGSCore::getInstance()->trace("Hello World!");
- C#
gs.TGSCore.getInstance().trace("Hello World!");
- Javascript (Running on UI_HTML pages)
gs.core.trace("Hello World!");
- Delphi
  uses GS5;

  TGSCore.getInstace().trace("Hello World!");
UI debugging
To debug license UI, please refer to Enable UI Debug
Crash Dump
If your app crashs unexpectedly on Windows platform, the crash dump is very useful to help inspecting the root cause of the issue.
SoftwareShield supports built-in crash dump debugging, please refer to Crash Dump for details.
The crash dump file can be loaded in a debugger such as VisualStudio IDE or WinDbg to figure out the crashing site.
License Snapshot Utility
When a license issue occurs, it is helpful to take a snapshot of the current license status from the end user's nachine.
You can download the snapshot utility from here:
This DOS utility takes snapshot of the current local license data.
-
Usage:
LicenseSnapshot [ filename ]
-
Parameter
filename: OPTIONAL, specify the output filename of snapshot file.
If the filename is not specified, the output will be saved as "LicenseSnapShot.0", "LicenseSnapShot.1", "LicenseSnapShot.2", etc. in the same folder as the utility.
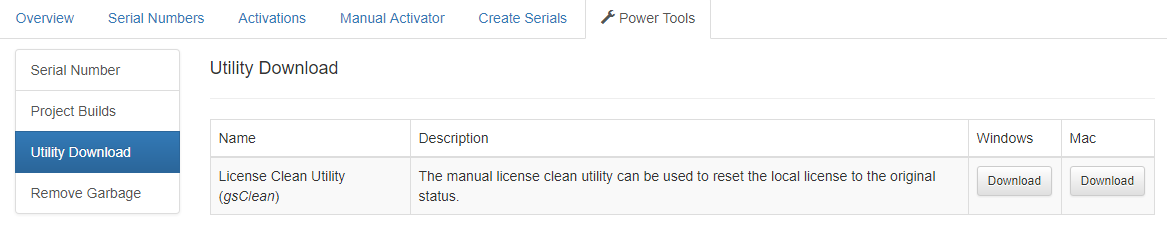
License Clean Utility
WHen a license issue occurs, such as local license storage is corrupted, you can run the license clean utility (KeyClean) to erase the local license as if the app is not installed before.
If the app relies on trial period, it means the trial period is rolled back after the local license is cleaned up. Your app can detect if there is a valid license and runs app in trial mode, please refer to Test if app should run in demo mode for details.
The KeyClean utility can be downloaded from our License Management Web Portal,
The KeyClean utility can also be found in the app's license project folder:
<license_project_dir>\release\KeyClean\